
Discover the latest trends and insights
Artificial Intelligence
A Basic Guide on Cross-Entropy in Machine Learning
This blog post discusses the Entropy and Cross-Entropy functions and how to calculate them from our dataset and the predicted values. The more you know about your data matrix, the more effectively you can implement the discussed methodologies. While dealing with methodologies and algorithms of Machine Learning, Neural Networks, or Deep learning models, loss/cost functions are used to evaluate and improve the model’s accuracy during the training phase.
All this effort is centric around the minimization of the loss function. The lower the loss, the more accurate and precise the model. Cross-Entropy loss is a notable cost function used to optimize classification models. Consider a 4-class classification algorithm that recognizes an image as either a car, a bike, a plane, or a boat.
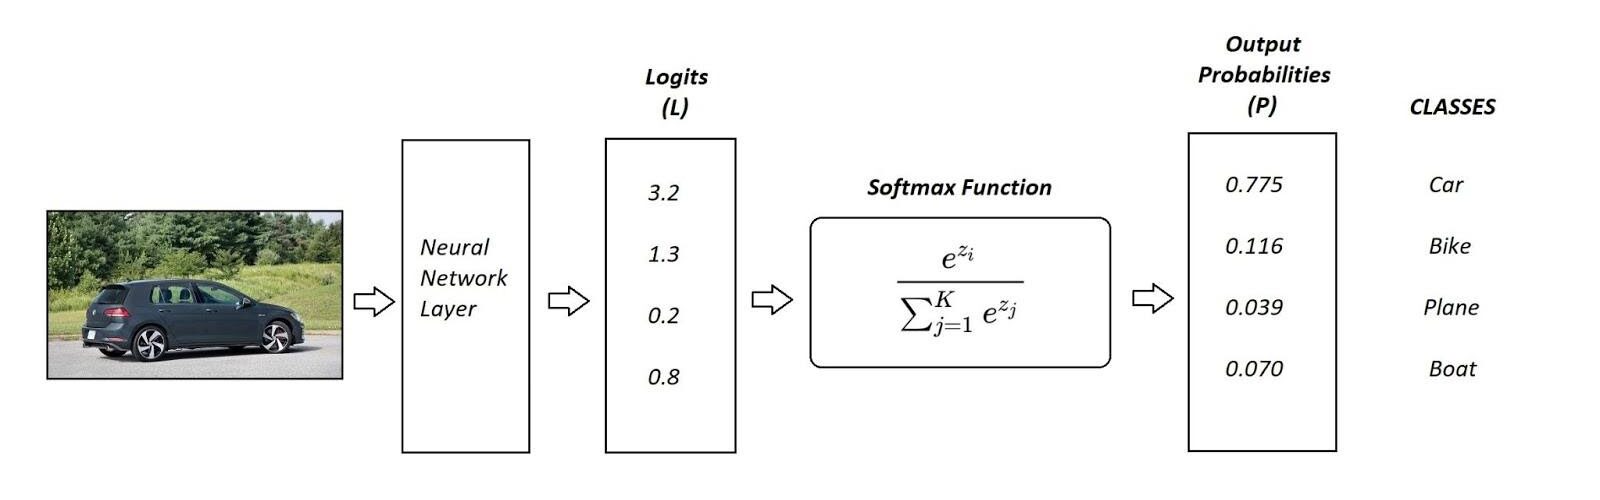
In the illustration above, a Softmax function is used to convert logits into probabilities. The Cross-Entropy takes the output probabilities (P) as input and calculates the distance from the true values.
For an aforementioned example the desired truth output is [1,0,0,0] for the class Car but the model generates probability distribution values as [0.775, 0.116, 0.039, 0.070] .To train the model so that it delivers the output with as much proximation as possible to the desired outcome, truth values. During the training phase, the model weights are adjusted several times to minimize the Cross-Entropy loss. This process of adjusting the weights is known as the training phase in Machine Learning, and as the model progresses with the training and the loss starts getting minimized, it is said that the machine is learning.
Entropy - In a Nutshell
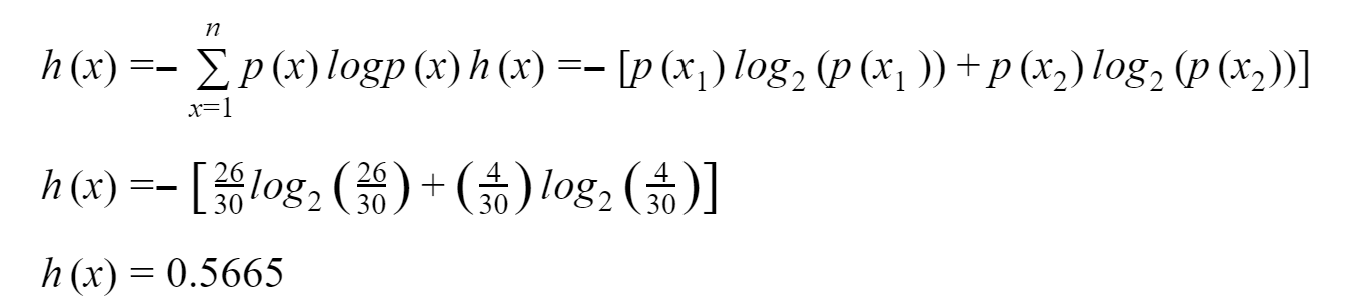
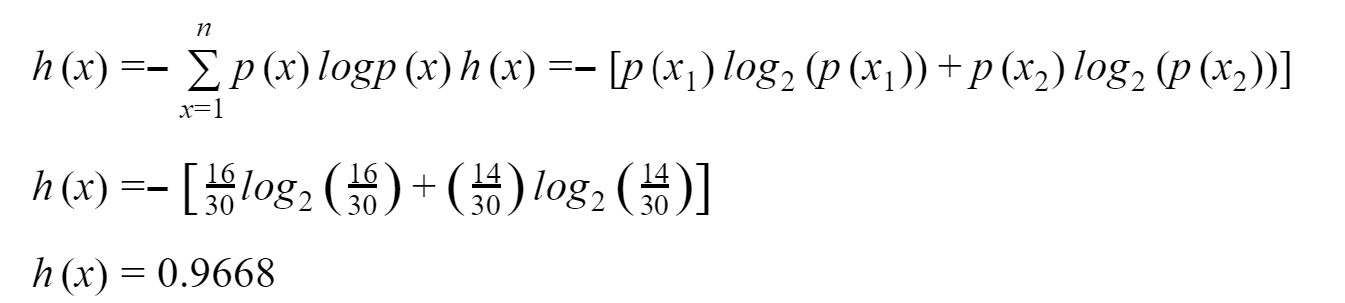
Claude Shannon first gave the idea of cross-entropy as a theoretical and mathematical approach to computer science. Before discussing the Cross-Entropy cost function, let find out what entropy is. For function p(x) that denotes probability distribution concerning the random variable X, entropy h(x) is given by a relation:

Where log is calculated to base 2. Since log[p(x)]<0, for all p(x), it is taken as negative. p(x) is a probability distribution, and therefore the values range from 0 to 1.

A graph of log(x). For x values ranging from 0 to 1, such that log(x) <0.The entropy is given by h(x) impacts so that with a greater value of h(x), the greater the uncertainty regarding probability distribution, and vice versa.
Example
Consider the following three containers having spheres and cubes.
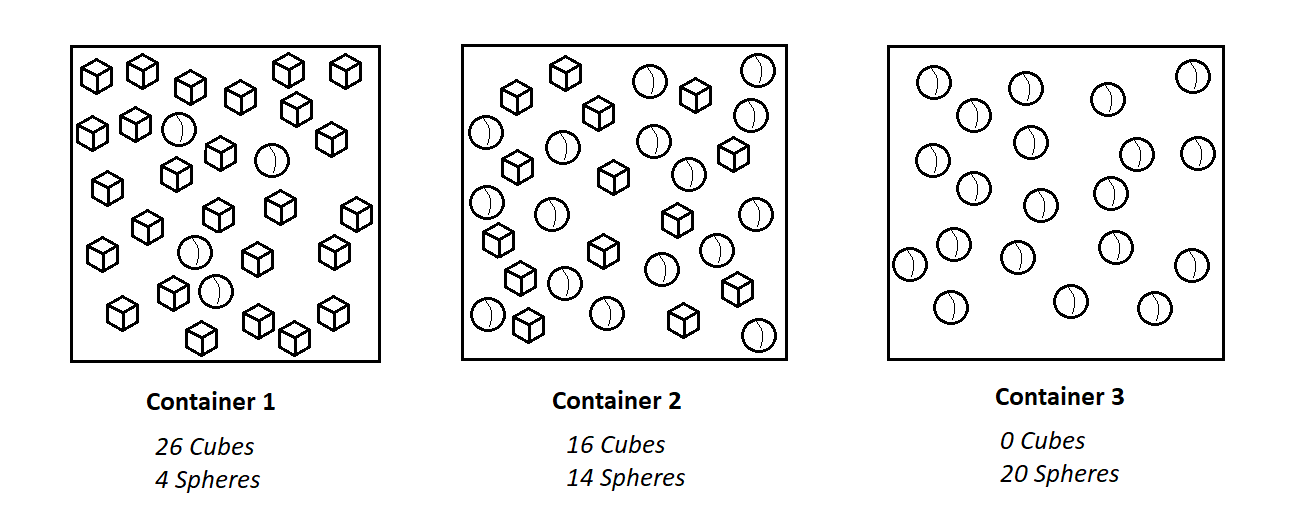
Container 1: The probability of picking a cube is 26 out of 30, and the probability of picking a sphere is 4 out of 30. Due to this, the probability of choosing the cube and not picking the sphere is considered as the more established condition.
Container 2: The probability of picking the sphere is 14 out of 30, and that of the cube is 16/ out of 30. There is almost a 50 percent chance of picking any specific object. Less certainty of picking anyone definite object than the 1st container.
Container 3: An object picked from container 3 is undoubtedly a sphere. The probability of picking a sphere is 1, whereas the probability of picking a triangle is 0. The fact is clear that the shape picked will be a circle.We can cross-check the conclusions above about the certainty of picking a given object by calculating the entropy.
For Container 1:
For Container 2:
For Container 3:
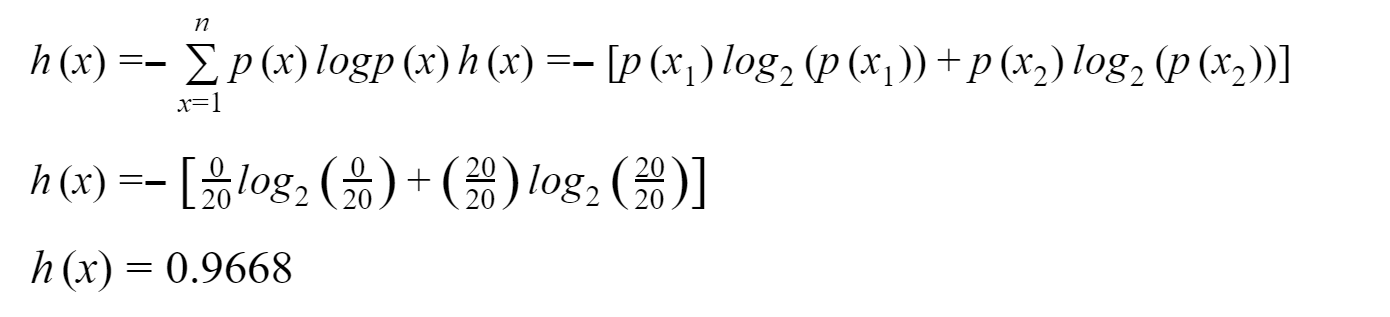
As we have discussed earlier, the entropy for the first container is less than the entropy of the second container. The reason is, the probability of picking a given object is more certain in the case of the 1st container as compared to the 2nd one. The entropy for the 3rd container is 0, which reveals the perfect certainty of the condition.
Cross-Entropy Loss Function - How it Adjusts Weights
For now, you have cracked the riddle about how entropy works. Now it’s time to discuss Cross-Entropy Function in detail. This mathematical representation of entropy is also known as the logarithmic loss or logistic loss. Each predicted class probability is compared against the actual class's desired output (0 or 1). A loss is calculated that is being used to penalize the probability based on its deviation from the actual desired value (truth values).
Also Read: 8 Applications of Data Clustering Algorithms
The penalty is assigned in terms of logarithmic value that provides enough range as large values for deviations nearest to 1 and smaller values for smaller deviations nearest to 0.Cross-entropy loss is used when adjusting model weights during training. The aim is to minimize the loss, i.e., the smaller the loss, the better the model. A perfect model has a cross-entropy loss of 0.
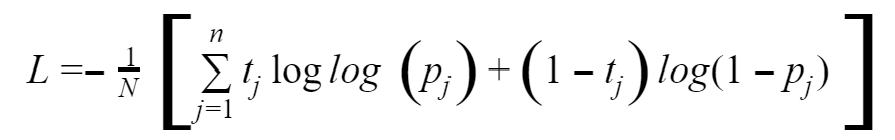
An equation gives Cross-entropy:
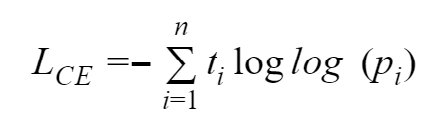
Where n shows the number of available classes, ti is the truth label, and pi is the softmax probability for available classes.
Binary Cross-Entropy Loss
For binary classification, we use binary cross-entropy that is given by a mathematical relation:
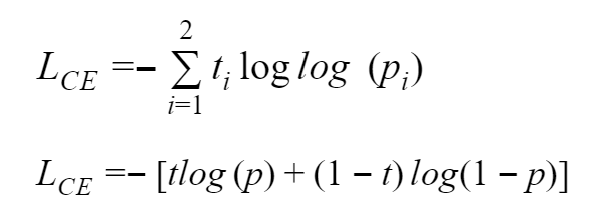
Binary cross-entropy is calculated as the average cross-entropy across all available data points.
Example
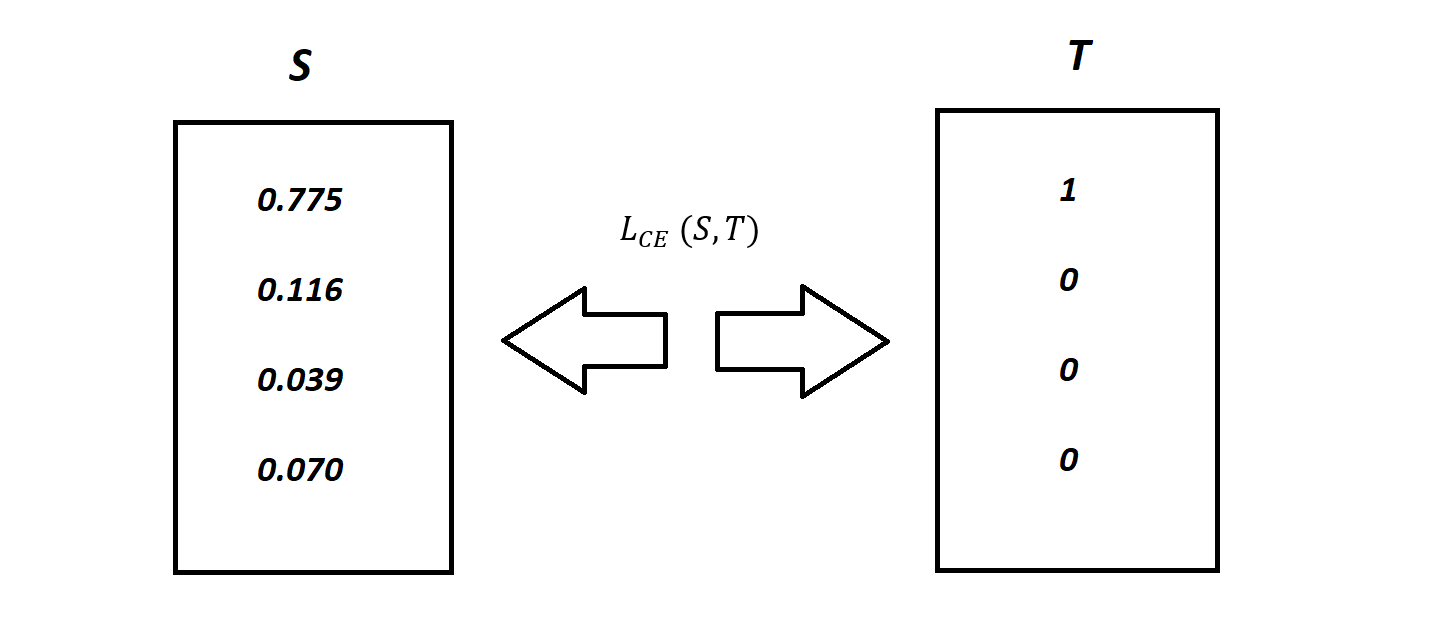
Recall the above classification problem of cars and other transport mediums with the Softmax probabilities (S) and the labels (T). The purpose of the Binary Cross Entropy scheme is to calculate cross-entropy loss provided such information.
The categorical cross-entropy is calculated as:

Softmax is a continuously differentiable function that makes it possible to compute the derivative of the loss function concerning every assigned weight in the neural model. This attribute enables the model to adjust the weights following the minimization of the loss function. By doing so, the model pushes the output values close to the true values. Assume that after the repetitive training of the model, the output showcases the following results.

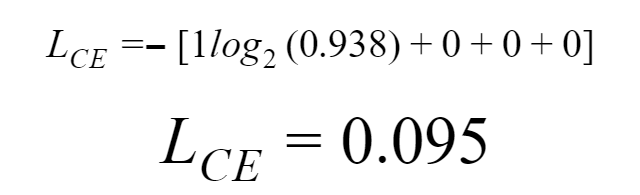
0.095 is less than the previous loss (less difference in softmax value and truth-values that is 0.3677), given that the model is still learning with every cycle. The cycle of adjusting weights to bring output values close to desired or truth values continues until the training phase is completed.
Keras provides the utilities of the following cross-entropy loss functions:
- Binary
- Categorical
- Sparse
Categorical Cross-Entropy and Sparse Categorical Cross-Entropy
Both categorical cross-entropy and sparse categorical cross-entropy loss functions have the same loss function as the aforementioned cross-entropy functions. The only difference between these functions depends on how truth labels are defined. In Categorical cross-entropy, truth labels are encoded as binary odds for instance the truth labels for 3 class problem are given as [1,0,0], [0,1,0] and [0,0,1]. Whereas, in sparse categorical cross-entropy, truth labels are expressed as integers, such as [1], [2], and [3] for the 3-class problems.
Conclusion
Mathematics is the backbone of machine learning algorithms. As we have discussed all the mathematical formulas related to cross-entropy, it reveals that a sound grip over mathematics supports understanding machine learning.
9 Ways PowerBI Can Improve Organization Management
If you want to deploy self-service business intelligence or reporting solution, you have likely come across Microsoft Power BI. But is it the right business intelligence platform for your organization? How will Power BI benefit your business? This blog post is intended to address all such queries. Here is what you’ll need to know if you’re considering Power BI management.
Power BI in a nutshell.
Power BI is the collective name for various cloud-based apps and services that help organizations collate, manage, and analyze data from various sources through a user-friendly interface. Business intelligence tools like Power BI can be used for a multitude of purposes. Primarily, Power BI pulls data together and processes it, turning it into intelligible insights, often using visually compelling and easy-to-process charts and graphs. This allows users to generate and share clear and useful snapshots of what’s happening in their business. Power BI connects to various data sources, from basic Excel spreadsheets to databases and cloud-based and on-premise apps. Power BI is something of an umbrella term. It can refer to either a Windows desktop application called Power BI Desktop, an online SaaS (Software as a Service) service called Power BI Service, or mobile Power BI apps available on Windows phones and tablets and iOS and Android devices. Power BI is built on the foundation of Microsoft Excel, and as such, the learning curve from Excel to Power BI is not that steep; anyone who can use Excel can use Power BI, but the latter is far more powerful than its spreadsheet counterpart.
Functions of Power BI
Microsoft Power BI is used to run reports and surface insights based on a company’s data. Power BI can connect to a wide range of data sets and “tidies up” the info it’s fed so that it can be better digested and understood. The reports and visuals generated from this data can then be shared with other users.
Power BI helps users see what’s happened in the past and what’s happening in the present and what might happen in the future. Power BI is infused with machine learning capabilities, meaning it can spot patterns in data and use those patterns to make informed predictions and run “what if” scenarios. These estimates allow users to generate forecasts and prepare themselves to meet future demand and other key metrics.
Why do Organizations use Power BI?
Power BI is the next level in business intelligence for businesses who want more reporting power and analytical muscle than Excel. With Power BI, businesses can assemble, scrutinize, and visualize data from across the company, giving them greater insight into their operations and performance and making more informed decisions based on real data.
Here are some of the key benefits of using Power BI Management:
- Businesses can input huge quantities of data into Power BI that many other platforms would struggle to process
- Built-in machine learning features can analyze data and help users spot valuable trends, and make educated predictions
- Information can be visualized using powerful templates to allow businesses to make sense of their data better
- Power BI is cloud-based, so users get cutting-edge intelligence capabilities and powerful algorithms that are updated regularly.
- Powerful personalization capabilities allow users to create dashboards so they can access the data they need quickly.
- Alerts can be set up on KPIs to keep users up with date important metrics and measurements.
- Power BI has an intuitive interface that makes it more user-friendly and easy to navigate than complex spreadsheets.
- The platform integrates with other popular business management tools like SharePoint, Office 365, Dynamics 365, and other non-Microsoft products like Spark, Hadoop, Google Analytics, SAP, Salesforce, and MailChimp.
- With data security a massive talking point for modern businesses, Power BI management ensures data is safe, offering granular controls on accessibility both internally and externally.
So, what are the top reasons for using Power BI for your business?
Reason #1: Allows you to build personalized dashboards and interactive reports easily
Power BI is known for its dashboards, which can be customized to fit your company’s requirements. It also has intuitive and interactive visualizations. Plus, thanks to the easy drag-and-drop functionality, your staff can easily generate custom reports quickly. You can easily choose from limitless options and produce powerful models and visualizations.
Reason #2: Gives you access to real-time information
Your dashboards will update in real-time. As data is pushed or streams in, the dashboard will display and update your visuals with the new information, as data is updated several times per day. This gives your staff the ability to solve problems quickly, identify opportunities, handle time-sensitive data or situations more efficiently.
Reason #3: Supports a wide range of data sources and integrations
You can import data from a wide range of data sources. Power BI seamlessly integrates with Microsoft products, such as Dynamics 365, Excel, Azure, and more. It also offers data connectivity with third-party tools and solutions, like Salesforce, Google Analytics, Spark, Hadoop, and more. It can also connect to data files (such as XML and JSON) and SQL server databases. This means you will be able to connect to all sorts of data sources for your analysis and reports.
Reason #4: Offers an unparalleled Excel integration
Many businesses still heavily rely on Excel when it comes to analytics and reporting efforts. Power BI integrates seamlessly with Excel. Without learning a new application or language, you can easily connect queries, data models, and reports to Power BI dashboards and create interactive visualizations. You can set it up so that you get the right data instantly when you open your dashboard.
Reason #5: Is affordable and cost-effective
Power BI is relatively inexpensive for small and mid-sized businesses compared to equivalent business intelligence and analytics tools. It also offers numerous versions so that you can pick the one suited to your business. For instance, Power BI Pro is ideal for small and mid-sized companies, and you can get access to a host of features for as little as USD 9.99 or CAD 12.80 per user per month. You can also download the free version, Power BI Desktop, and start using it to make reports and dashboards on your computer.
Reason #6: Has Regular Monthly Updates
Another striking feature of Microsoft Power BI is that there are regular monthly updates made to the platform. Microsoft also listens to the Power BI community suggestions and implements most asked for functionality on a regular. This means users always have access to the latest and advanced features to help make accurate business decisions.
Reason #7: Allows you to deploy multiple dashboards with Power BI Apps
In many companies, business users need multiple Power BI dashboards and reports to run their business. With Power BI apps available for Power BI Pro users, you can quickly deploy a collection of purpose-built dashboards and reports and efficiently distribute them to the whole company or specific groups of people. This feature also gives report developers the power to customize navigation to help viewers find content quickly and understand the relationships between different reports and dashboards.
Reason #8: Lets you take advantage of cutting-edge AI
Take advantage of Microsoft AI's latest advances to help non-data scientists prepare data, build machine learning models, and find insights quickly from structured and unstructured data, including text and images.
Reason #9: You don’t need specialized technical support
Power BI empowers your staff to create analyses and reports without requiring a technical or IT team to help as a self-service business intelligence platform. It supports a natural language interface, uses intuitive graphic designer tools, and has a simple drag-and-drop functionality to create dashboards.
Conclusion
Microsoft Power BI may be right for your business if you are looking for reporting and analytical capabilities that go beyond Excel. With Power BI, you can easily visualize and analyze data across your entire business and gain deep insights into your operations and performance. Recognized by Gartner for the thirteenth consecutive year as an industry-leading business intelligence platform, Power BI management can help you drive better decisions across your organization.
Advanced BI Tools Comparison - Data Studio vs Tableau vs Power BI
In this article, we will discuss some of the most popular BI tools available in the market. Data is only as useful to the experts as the learnings and insights. A positive aspect is that data visualization tools are here to assist us in driving fruitful insights from all the numbers. Organizations use different tools for data visualization to attain a better understanding of their business data. Using Business Intelligence tools, one can perform a lot of cool stuff with the data, like transform, analyze, and present it. From an absolute perspective, all BI tools make the data come alive.
There are various data visualization tools available in the market that offer a range of features and usages .to make the data more visual. All you need to do is select one that best sustains your organizational needs. With various viable options, it isn’t easy to choose one as per your requirements and feasibility. This blog post is intended to give you a clear picture regarding comparing the three most used BI tools: Power BI, Tableau, and Google Data Studio. Let’s discuss each of these tools in detail.
Microsoft Power BI
With a newly emerged sense of data as a capital, data visualization and data science are becoming the most trending areas globally. Every organization wants to turn raw data into a meaningful portrait of information. Power BI is a free or low-cost cloud-based analytical tool offered by Microsoft.
Power BI is a very outstanding analytics service in the BI domain. Like any Business Intelligence tool is intended to produce interactive and easy-to-grasp reports and dashboards to visualize your data insights.Power BI accommodates many on-premises and cloud-based services, and you can either import or export your files to perform any transformations and analysis. You can combine data coming from different sources, model it, and generate schemas as well.Power BI offers services like:
- Power Query for data transformation
- Power Pivot for tabular data modeling
- Power View for visualization
- Power Map for geospatial data
- Power Q&A for questions and answers
Why Choose Power BI?
Effective Cost
Power BI is a budget-friendly product. It is free to use if you want to build reports for yourself. A Single individual could generate datasets, dashboards, and reports in Power BI and provide these Power BI reports and files to employees for further analysis. Each individual would have their version of Power BI and would need to handle the data and reports independently. If everyone in a company or group wants to collaborate by sharing the same reports and data, Microsoft offers cloud or on-premise services against nominal service charges per user.
Power BI Desktop–$0.00
Power BI Cloud Service –$9.99 Monthly
Ease of Use
Power BI is easy to use as its Excel pivot tables having Excel’s data visualization tools with some additional state-of-the-art features. Using the Power BI dataset for making charts, graphs, and tables that decorate the presentation of your data is not that difficult. Any individual with average Excel expertise can learn to use it on their own. Power BI reports possess slicers for categorical reports regarding specific data according to a certain time frame or criteria. One report can filter sales by a person for a specific product line for a specific month, and then, by making few clicks, you can showcase sales per month for one customer. One can become an expert by using Power BI for 5 to 6 months.
Consistent Updates and Innovations
Microsoft makes necessary updates to Power BI frequently. Moreover, Microsoft listens to the user community and responds to their necessities. It is worthy of making suggestions or complaints about necessary improvements. People from the community can rate the suggestions as well, making it more certain that popular interests make their way into the upcoming update. Updating doesn’t require you to make any effort. Once you open Power BI, it will remind you if there is any new or pending update. Just click the link to download and install the updated version.
Data Sources
Power BI can establish rich connections with hundreds of data sources and fetch data from MS Excel and text files like XML and JSON. It can connect to SQL Server and other database platforms. It can also fetch data from Azure cloud services and other online services like Google Analytics and Facebook. Data can be downloaded from one or more sources and stored in datasets for offline analysis. Alternately, you can make queries directly to pull data in real-time.
Excel Integration
Another notable attribute of Power BI is its tendency to save data to Excel. No matter how comprehensive the data visualization tool is, people always prefer to perform a conventional analysis by putting it in an Excel sheet. Power BI allows this practice to be performed easily.To do so, first, use the slicer tools in a report to select a specific piece of data—for instance, all sales records for the past five months. Then, performing few clicks will lead to a dialog box to save the data in Excel. You can now move to Excel and observe the actual and raw data behind the visualization.Power BI is a web-based tool that can be used on multiple devices and accessed from any browser. There also exists an offline variant that can be used offline to produce visual illustrations and analyze data. Power BI variants that run on smartphones help give Managers, CEOs, CMOs, etc., convenient and instant access to their team or business, anytime and anywhere.
Custom Visualizations
Power BI is richly supplied with state-of-the-art tools and options that allow the data to come alive. Visualization is what makes data science a driver of business decisions. Just like Excel, Power BI possesses different layouts and types of graphs and charts. Apart from that, data can be converted into information-rich content with the help of geographic maps.
Also Read: How to build a Successful B2B Lead Generation Funnel
It also has a KPI visualization tool and one called “R script visualization.” A single report can be portrayed or illustrated using a multitude of visualizations. Reports contain title boxes and cards to improve the experience. Slicers can be used to remain specific or general by selecting all reports in a dashboard or only one report. A single click on data can provide a more comprehensive view or report. All these flavors make the recipe of Power BI more interesting.
Reasons Not to Choose Power BI
The User Interface
The user interface of Power Bi is not user-friendly and showcases a very bulky look. The side panel and formula help windows can often block the view of important content.
Data Handling Capacity for Free Versions
Another downside is its tendency to work with huge amounts of data. Power BI has a limit on the amount of data it can grasp. Once the data reaches the upper limit, you must upgrade to the paid version of Power BI. Also, fetching millions of rows of data is a slow process. This can’t be put into the Power BI account, but it can be frustrating if you create datasets using big data.
Visuals Configurability
As the native visuals and, up to a large extent, the custom visuals are not configurable, the desire to optimize a visual output is limited by what can be changed.Overall, Power BI is a superb tool to perform data analysis and visualization. The advantages outweigh the disadvantages. Individuals required to work on pivot tables, charts, and simple formulas in Excel can start using Power BI to transform data into information easily.
Tableau
Tableau is another data visualization tool. It is considered a vital part of a data analyst or data scientist’s expertise, with many organizations making it mandatory as a primary skill while recruiting experts.The layout of conventional BI tools possesses some hardware boundaries. Still, as far as Tableau is concerned, it does not possess such dependencies and can perform well independently, and requires minimum hardware support. Mainstream BI tools are based on a complex set of technologies, whereas Tableau is based on Associative Search technology, which provides a fast and dynamic performance edge.Tableau allows multi-thread and multi-core computing and more advanced functionalities that traditional BI tools are failed to offer.Indeed, Tableau is the leader among all BI tools available. Let’s discuss what it has to offer and what its limitations are.
Why Choose Tableau?
Data visualization
The topmost perspective of Tableau is a data visualization tool. Therefore, its functions are rich enough to support complex computations and dashboarding for the sake of developing artistic and state-of-the-art visualizations. The output visuals showcase well-managed and beautifully represented illustrations of valuable insights that cannot simply be produced using an Excel spreadsheet. It has summited the data visualization domain due to its promising and dedicated functionality.
Quickly Create Interactive visualizations.
The drag-n-drop functionalities of Tableau allow individuals to develop a very interactive visual within a short period. The interface offers many variations while also bounding you from making charts that do not follow standard data visualization practices.
Ease of Implementation
With a variety of options available in Tableau, users can enjoy it while experiencing it. Also, Tableau is very easy to adapt compared to the mediums like Python and Domo; anyone without any prior knowledge of coding and programming language can easily get used to Tableau’s user-friendly interface.
Tableau can handle large amounts of data
Tableau can grasp millions of rows of data without any trouble. Different types of visualization can be created with a huge amount of data without the performance of the dashboards being disturbed. Also, there is an option in Tableau for users to establish real-time connections with different databases like SQLhelp give.
Use of other scripting languages in Tableau
To refrain from encountering any performance-related issues and perform complex tabular calculations in Tableau, users can implement Python or R. Using Python language. One can ease the load by performing data cleansing tasks with Python-offered functions and packages. Since Python is not a native scripting language that works side by side with Tableau, you need to import some of the visuals or packages.
Mobile Support and Responsive Dashboard
Tableau Dashboard offers an outstanding reporting feature that enables you to personalize the dashboard for a specific device such as a smartphone or PC. Tableau automatically acknowledges which type of hardware medium you are using and makes adjustments in such a way to showcase the right report to the right device.
Reasons Not to Choose Tableau
Now you know the positive aspects of this tool, let’s discuss some of the downsides.
Scheduling or notification of reports
Tableau does not allow automated refreshing of the reports due to the lack of scheduling options. Therefore, you must put effort every time you want to update the data in the back-end.
No Custom Visual Imports
Tableau is not completely open-source. Like other BI tools in the market, such as Microsoft Power BI, Tableau doesn’t support importing any new visuals. You have to recreate it.
Custom formatting in Tableau
Tableau’s formatting is limited to a 16 column table display, which frustrates the users. Also, to apply the same formatting layout to multiple fields, you cannot do that directly. Users need to perform manual formatting for each of the desired fields, making it a time-consuming practice.
Static and single value parameters
Tableau has static parameters, and only one value at a time can be selected using a parameter. Every time the data values get changed, these parameters need to be changed manually, and the user can’t automate the updating process of parameters.
Screen Resolution on Tableau Dashboards
The framing of the dashboards gets deformed if the developer’s screen resolution is different from the end user’s screen resolution. For instance, if the dashboards have a screen resolution of 1920 by 1080 pixels and the front end monitor’s resolution is set up on 2560 by 1440 pixels, it can cause the layout of the dashboards to get distorted. Also, its dashboards are not that much responsive.
Scaling and Pricing for Enterprise
Another trouble with Tableau is its cost to implement across a huge organization. Compared to other cheaper BI tools, Tableau is one of the most expensive options. The only option available for security and data sharing is Tableau Server, which costs around $180,000 for an eight-core option and around $30 per user.
Tableau Company Strategy
Tableau has done a great job making its space among the state-of-the-art data visualization tools. However, with the sudden ups surge in data science, artificial intelligence models, and machine learning, Tableau won’t survive and thrive if it doesn’t adapt to the contemporary situation quickly.
Google Data Studio
Data Studio is Google’s powered cloud-based visualization tool that allows you to create compact reports using its interactive dashboard. It firmly integrates with Google-based data sources, including Google Ads, Google BigQuery, & Google Analytics.Google Data Studio has a similar interface outlook as Google intended to provide non-technical users the opportunity to visualize data. Data Studio possesses 17 connectors powered by Google with several other connectors provided by partners but mostly as paid services. Once the connection is established, you can add various data sources to Google Data Studio, build tables and charts, and produce reports using a simple and interactive interface. The reports you build can be shared among your team and clients as well.
Why Choose Google Data Studio?
In this section, let us dive into some Google Data Studio benefits.
Cloud-based and Completely Managed
Unlike other renowned BI utilities like Power BI and Tableau, Data Studio is designed to serve as a cloud-based service. It is a fully managed service that allows users to focus on visualization tasks without managing any infrastructure or installation.
Tight Integration with Google’s Ecosystem
As discussed above, the notable advantage offered by Data Studio is its ability to integrate with Google-powered services like Google Analytics, Google BigQuery, Google Sheets, etc. Consider your ETL process is mainly built on top of Google applications, you will spare a lot of time and effort when integrating with Data Studio.
Easy to Use
Data Studio provides a very interactive and easy-to-use user interface that allows you to create reports and dashboards within a few clicks.
Access and Sharing Controls
As a google powered service, it inhabits the granular access control and sharing options like that of the Google office suite. Sharing reports and dashboards with team members and clients with access control options is a very simple task in Data Studio.
Support for Live Connections
Data Studio provides live data connection opportunities compared to other visualization tools like Power BI, Tableau, etc. It means there is no manual effort or automation tools required to make the necessary updates in data. Every time a report or dashboard is accessed or refreshed in UI, it will fetch the updated and recent data. There also exists an option to adjust the fetch cycle using cache settings.
Free of Cost
Data Studio is a free and open-source service bundled with Google cloud services. Although, the storage and processing costs are of varying degrees based on one’s requirements.
Reasons Not to Choose Google Data Studio
Now let’s see some downsides of Google Data Studio.
Lack of Real-time Updates in the Dashboard
Despite the live connection being available for different cloud and data sources, no automated mechanism exists, for now, to keep a dashboard or report view auto-updated. So if you want to showcase a real-time and auto-updated dashboard every time you present it to your team members or clients, you have to wait for google’s developer’s team to make this option available.
No Support for Excel
Being a Google-powered product, Data Studio cannot be directly integrated with commonly used data formats such as Excel and prefers Google-based services. Excel can be integrated with Data Studio after converting it into a CSV file or a Google Sheet. Lack of Comprehensive Function Support Data Studio still lacks the functions offered by Tableau and Power BI. It lacks some fundamental functions like SUMX in Power BI that allows users to calculate the sum of values in a specific column or row.
Slow Speed in Case of Live Connection
The most-reported error in Data Studio is that loading the dashboard starts getting slower with the increase in complexity of functions used. This downside comes amidst the live connection functionality.
No On-premise Deployment Option
For organizations with strict data security protocols, and on-premise security option is the biggest ever drawback. Such businesses still prefer to use BI tools like Tableau and Power BI to provide desktop installation support and the freedom to access data within the internal network.
Lack of Native Connector Support for Cloud-based Data Sources
Data Studio doesn’t have built-in connector support for some of the most frequently used cloud services like Hubspot. Although you can find third-party and community-based connectors to fill this void, these are paid utilities.
Complex Visualizations Not Possible
You can easily set up basic visualizations in Data Studio, but it lacks support for mobility and personalization offered by other BI tools like Tableau. So businesses with analytical needs and expert analysts may find Data Studio not much appealing in terms of visualizations.
Conclusion
Big data is the new commodity in this data-driven world, and its importance and uses are exponentially increasing with every passing year. By utilizing visualization and BI tools, you can start your journey towards a new peak of data understanding. Your data management will become more rational, firm, agile, and precise regarding predictions and probability. We hope you have found this article helpful in comparing the best BI tools available in the market as per your feasibility and find a perfect match for your company & requirements. Reach out to us if you are looking for a technology consulting service to help you choose and implement the right BI tool for your business.
How to Build an Effective AI Model for Business
Artificial intelligence (AI) is the future of the technology-driven world. With every day passing, AI is revealing its potential bright side in different domains. Meanwhile, all tech giants such as Google, Microsoft, and Amazon deploy and implement intelligent methodologies across all the segments in their tech framework. AI model for business can help businesses streamline their processes and drive growth.
This advancement in AI and Machine Learning (ML) methodologies, along with the support of rich computational power, is transforming our tech world like never before. By unleashing the latent potential of all the data that organizations collect, AI and ML are indistinguishable from magic, as C. Clarke said quoted for sufficiently advanced technologies. How is this happening so fast? Because recent breakthroughs in machine learning (ML), computer vision, deep learning, and natural language processing (NLP) put the cup of AI on everyone’s table.
Using AI for Businesses Process
For businesses, AI can be deployed in different organizational processes such as business intelligence (BI) to deliver actionable information, data mining to improve customer engagement, and other automation tools to optimizing supply chain functionality.
Step 1: Understand the difference between AI and ML
People get confused when it comes to choosing between AI and ML. If you’re troubling with the same situation, let’s begin by exploring the differences between Artificial Intelligence and Machine Learning.
Also Read: Data Science Vs Data Analytics Vs Machine Learning: Know the Difference
The two terms are often used interchangeably, but they have some notable differences that impact their manifestation. If you can differentiate between them, you certainly know which technology to implement. Let’s dive into further details.
What is Artificial Intelligence?
Artificial Intelligence (AI) is an area of computer science that deals with developing intelligent machines that can think, respond, and solve problems just like humans can do. To make those machines act intelligently, they must be richly provided with enough information about the surrounding world.Artificial Intelligence was coined in 1956 when experts started finding ways to improve the problem-solving capability of computers. In the early 2000s, the development in this field started to acquire notable speed. Until now, AI has become a crucial element of every modern technology.
Some renowned examples of AI include autonomous vehicles, speech-recognition personal assistants, face-recognition systems, etc. Several other AI-based modern solutions have primarily used various business processes to automate and streamline repetitive tasks, improve customer engagement, targeted marketing campaigns, and increase operational capacity with less human resources.
What is Machine Learning?
Machine Learning is the methodology in Artificial Intelligence that uses computer algorithms and statistical models to train machines over massive datasets. By learning and extracting insights from data to conclude, make predictions & rational decisions for business-oriented purposes, ML serves as a state-of-the-art aspect of technology.ML models don’t require human assistance to learn through data patterns. Instead, it’s enough to give some necessary parameters and direction to analyze and compare, and they can figure out how to automatically utilize this information.In an actual sense, Machine Learning works just like the cognitive process of the human brain to acquire knowledge. Consider a toddler that is learning how to speak.
It gathers information from the surrounding, processes this information, and starts making meaningful sounds of its own after some time. This ability and skill began to grow with time. ML works in the same way. A machine gathers data inputs, breaks them down, builds connections, and translates them to deliver an intelligent solution.Now you can differentiate between AI and ML; let’s answer two essential questions about the ongoing thread before discussing AI implementation.
How can AI improve business effectiveness?
There is no absolute answer to this question as it depends on your specific needs and expectations. But some evident and promising main advantages include:
- Increase Employee Productivity
- Improve Marketing Strategies
- Spare Time and Energy
- Reduce Human Error Probability
- Get the best of Businesses Output
- Maximize Sales
- Open Opputininity Corridors
- Boost Revenue
Where is AI ineffective?
Despite being a superpower in the technology domain, AI also has some limitations in certain circumstances. To avoid any trouble and loss of investment, you must acknowledge what you should not expect from AI.
Awareness Limitation
Machines cannot program themselves as they lack awareness regarding our complex real-world problems. Thus, you cannot expect AI to understand our reality and do everything on its own.
Generate creative content
AI can create content using data but cannot maintain creativity in writing content or a blog. You cannot expect an AI to deliver a piece of art.
Ethical decision-making
Machines lack feelings and emotional intelligence because they don’t have consciousness. So, we can’t let them crack the decisive actions and make moral judgments for people that enjoy varying degrees of opinions and mindsets, and even humans fail to do so.
Dependence or Independence
AI can only help humans but cannot replace them. Several job roles are going to end due to machines taking over, but it comes amidst the introduction of several other job roles like data scientists, data analysts, and business analysts, etc. We cannot blindly trust AI to make decisions on our behalf, and we must appreciate this performance gap.
Innovation and invention
AI can extract insights and learn from data, but its ability to build conclusions is limited to some extent as it cannot be creative and comes up with innovative ideas or out-of-the-box solutions.
Step 2: Define your business needs
After acknowledging differences between Artificial Intelligence &Machine Learning, exploring the limitations and capabilities of AI, and filtering fact from fiction. Now you need to consider what you’re looking for and how these two technologies can help you get where you want?First of all, outline the problems you want AI to solve by trying to answer these five questions:
- What outcome(s) are you expecting?
- What are the primary roadblocks in achieving these outcomes?
- How can AI add value to your business that other measures fail to do?
- How can you define success?
- How much data you have readily available, and what additional data do you need to employ?
The answers to these questions effectively define your business goals clearly, then head towards the optimistic solution.
Step 3: Prioritize the main driver(s) of value
Once you’ve defined your business goal, you need to rectify your prioritizations regarding your AI project’s potential business and financial benefits. You should consider all the plausible AI solutions and try to relate each option with dedicated returns. To do so, focus on short-term objectives and encapsulate either the financial or business value that best suits you as per your circumstances and conditions.While outlining your objectives, refrain from ignoring the value drivers such as increased value for consumers or enhanced employee productivity and feasibility.
Must consider the aspects and domain where machines can outperform the human factor, especially regarding iterative or cyclic tasks.Beware of not implement solutions based on fiction or impractical optimism. Popular opinion is sometimes not a sane idea.Instead, consider if you can efficiently augment a solution into your work routine, analyze how it sustains your business model, and evaluate whether integrating an AI-based solution to your existing business model would increase your operational capability over the long run.
Step 4: Evaluate your internal capabilities
There’s often a void between what you want to do and what you can acquire within a specific period. Therefore, after aligning and sorting your priorities, it’s required to decide which approach best suits your condition. It can help in:
- Developing a new solution using internal resources
- Employing a ready-made product
- Collaborating with a partner to build an AI-based solution
- Outsourcing the resources or a team for AI development and integration
Again, choose the option that best suits your objective and available resources. Keep in mind to do in-depth research on existing solutions before jumping into the lengthy process of development. Try to find a product that meets your criteria and integrate it into the current business model. This is one of the most cost-effective practices.
Step 5: Consider consulting a domain specialist
If you already have a highly skilled developer team, they can just maybe build your AI project off their own back. Regardless, it could help to consult with domain specialists before they start.Developing AI is not the same as building typical software. AI is a hyper-specific specialism that’s difficult to learn. It requires lots of experience and a particular combination of skills to create algorithms that can teach machines to think, improve, and optimize your business workflows.
If you have any doubts, you may simply choose to outsource your AI development to an agency specialized in big data, AI, and machine learning. AI agencies not only have the knowledge and experience to maximize your chance for success, but they also have a process that could help avoid any mistakes, both in planning and production.
Step 6: Prepare your data
AI is a kind of superpower. To make it perform at its best, you need high-quality and clean data. But what does clean mean in this scenario?The clean dataset is the one that is:
- Free from inconsistent information
- Accurate up to the highest degree possible
- Organized in such a way that it contains all the necessary data points required by an algorithm
Data is the key. Even the most advanced algorithms cannot return you the desired outcomes if you lack high quality and clean data set. The prerequisite to AI is to organize, filter, and enlarge your dataset as much as you can.Indeed, investing in the quality of data is something you'll never regret. Integrating an AI-based solution is not the liner or one-time task like mainstream software deployments.
The process involves a series of scalable solutions and updates, but you must build their foundations on pure data to adapt to this development and integration environment. Similarly, the more data you have, the better and accurate outcomes your AI solution can provide you.After getting your data prepared and refined, don’t forget to make it secure and protected. Mainstream security measures like encryption, anti-malware apps, or a VPN are enough to protect your data asset. Don’t hesitate to invest in modern security infrastructure.
Step 7: You’re ready to start - but start small
Approaching this step, you’re almost prepared to start. It’s good to stay a little insecure. Stay attentive and selective while feeding your data to the AI. Refrain from installing all your data in the machine and waiting for ripened fruits.Start by feeding the algorithm with a sample dataset and use AI to evaluate the results. If the odds turned out to be in favor, launch the solution carefully with necessary preventive measures.
You can track the performance of your newly installed AI against the train set and then gradually start supplying the system with your test set that the machine has never read before.The strategies above serve as preventive measures and strategic steps to successfully build a dedicated AI solution without any plausible loss or damages.
AI Solutions You Can Implement Today
Here are some practical examples of AI applications that businesses are already using nowadays. Modern companies implement these solutions to automate and enhance business processes, gain a competitive edge over rivals, and boost their investment (ROI).
AI-based Recommendation Engines
AI-based product research tools are among the most trending artificial intelligence applications in the retail and e-commerce industry. They assist companies and business owners in predicting consumer behavior and buying patterns to offer personalized advertisements, enhanced engagement, and uplift revenue via upselling and cross-selling.
According to research, recommendation engines drive around 25% more site traffic and 25% more revenue and boost the probability of confirmed orders by over 10% as an average.
These solutions utilize algorithms gathering historical data such as past purchases, product search, customer demographics, and build recommendations to suggest each client “things they may also like” and propel higher sales. They also make use of content-based filtering and collaborative filtering. The first method considers keywords typed by customers when searching for products online; the second makes shopping predictions based on customer behavior and preferences.
Chatbots
Today, it’s becoming ridiculous to be surfing any site without ever falling prey to the chatbot. Bots have penetrated the abyss of the enterprise domain. Many businesses rely on utilities like Google Dialog flow or Motion.ai to develop personalized chatbots and integrate the interactive medium on their sites to engage more customers intelligently and smartly.
Since AI-based bots are generally linked with a communication medium, they can also prove helpful in handling routine tasks. Intelligent bots are becoming human counterparts in scheduling appointments, sending emails, and public dealing up to a great extent in domains like travel bookings, order confirmation, etc.
Business Process AI Automation
Another notable aspect of the deployment of artificial intelligence in business models is business process automation (BPA). This methodology addresses the problems associated with automating iterative business processes and routines that enable an organization to save effort, time, and human resources for core business processes and areas. It allows companies to utilize the full potential and skills of employees for more significant problems and tasks. Irrespective of the nature of the iterative process or routine, we can streamline and automate it by integrating AI and ML solutions.
For instance, consider extending the influence and role of Artificial Intelligence and Machine Learning in airline ticketing services. BPA model can manage all functions related to ticket availabilities, perform text recognition to recognize customer’s interests, prioritize seat availability options by filtering all the data points that reveal customer’s mindsets, and finally inform public service agents about complaints and issues addressed immediately.
Existing Artificial Intelligence solutions also help businesses to streamline human resource departments in the hiring domain. For instance, an AI-driven system can handle the delivery and receipt of recommended documents. It can also notify new employees about the company policies, rules, and regulations and recommend necessary procedures to practice as they come onboard. ML and AI-based solutions can also respond to some FAQs that new employees are likely to ask.
Customer’s Behaviour Prediction
Imagine if you know with high certainty what your customers will most likely buy and use that insight to boost sales by offering packages. AI gives a magical wand that can do it for you. Predicting customer behavior with predictive analysis allows businesses to engage more customers effectively and increase sales by offering relevant products and services.
By mining the data from eCommerce sites and social media, predictive AI algorithms capitalize on the deep insights they extract from every customer’s data and develop an offer with a high probability that customers are more likely to buy. This capability provides retail and eCommerce businesses with the gateway to engage favorable customers at a favorable time, prioritize those who are more likely to purchase products or services resources, and attract them to move forward with a purchase by sending notifications and reminders, social media advertisements, and personalized emails with promotional offers.
AI-based Anomaly Detection
Anomaly detection deals with the capability of detecting abnormal and dubious behavior or patterns within the gathered data pool. This service can be used explicitly in extensive datasets that would be more complex to handle and unlabelled data that are more difficult to analyze for mainstream analytical solutions.Historically, businesses used to detect problems, errors, and damages after their occurrence. They would indeed have some preventive measures, but those supplements are based on predetermined situations, making them outdated for today’s rapidly evolving, increasingly complex business environment.
AI provides a solution with predictive analytics and intelligent Machine Learning algorithms, uplifting businesses while filtering anomalies and gaps in various business processes. Supervised anomaly detection is the methodology that processes data to separate normal” from “abnormal” based on the categorical variables and labels they were supplied with. The unsupervised approach involves its methods to detect data that appears to be somehow distinct from the rest of the mass. These approaches and methodologies can be used to detect fraud, network intrusions, and any other segment where anomalies can damage efficiency and put stress on cost.
The examples above are a glimpse of what AI can do. Other real-life examples include order predictions, speech and image recognition, and much more.
Conclusion
We have discussed what AI and Machine Learning are capable of doing and how they can assist businesses to enjoy the various benefits and independence, and they will continue to expand up to new horizons. AI-driven solutions possess some unique features, making them more complex to deploy. Below are few golden rules to keep in mind while going through this extensive exercise. Firstly, the development depends on the quality and quantity of data available at the moment. If data is corrupted and lacks organization, the project will surely fail, no matter how intelligent your AI model is.Secondly, the best AI experts are very hard to find and demand high salaries in return for their services. It makes the in-house development process very expensive and complex.
Outsourcing is the key here.Finally, the development of AI-based solutions requires extensive knowledge and expertise to align with the problem you’re trying to curb accurately. If this alignment fails, it may either turn out to be a chaotic scenario or a complete loss of resources, time, and money.The development of an AI-based solution capable of handling several business processes proceeds in almost similar phases as other software development life cycles but needed to be dealt with extra care. The whole idea is to perform information and resource gathering, followed by research and validation, data cleansing, then move to the development phase and testing with necessary data security protocols and preventive measures that lead to the final product creation, finally release the product and make regular reforms to add more value.Let us know about your experience or queries in the comments section below about building and using an AI model for business.
AI Trends and Future Insights for 2022 and Onwards
In recent years, artificial intelligence has displayed highly positive developments. AI and ML both showed progression in 2020 despite the COVID-19 pandemic, but 2021 is innovatively shaping the future of artificial intelligence. AI is without question a significant trend in the technological innovations that can transform our way of living, interacting, and working in the immediate future.
Artificial Intelligence has given birth to countless new jobs and business opportunities as people will adapt it to structure a new way of life, and it will be used to tackle problems like the global pandemic we faced in 2020 that demolished many jobs and what we considered normal. The current happenings and future are highly dependent on technology with AI being an integral part of it.
AI Trends and Future Insights for 2022 and Onwards
Every business should be aware of the current and growing AI trends to implement them to have more productivity. Keep reading to feed your minds with the information of Current AI Trends and Future Insights for 2022 and onwards in this article.
AI-Powered Chips
The rise in AI technology would need a processor that can rapidly process the data required by these technologies. Even the most advanced CPUs of today can not deliver the speed that AI requires. According to the Allied Market Analysis study, the AI chip industry's market size would surpass $100 million by 2025.

Image Source: AlliedMarketResearch
AI-enabled chips can manage incredible processing speeds, are more responsive, and undoubtedly have businesses invest tremendously in them. The AI chips are not just about speed; they contribute to a strategic advantage as well. AI-enabled chips are also built to allow faster and easier predictive analysis and sophisticated algorithms required by AI algorithms.

Image Source: Scitechdaily
The growth of AI-enabled chips would contribute to creating autonomous robot systems - i.e., with AI-enabled chips, there will be an increase in the production of robots that will make their own decisions and monitor themselves.
Stronger Cybersecurity
Artificial intelligence and machine learning technologies are significant catalysts for cybersecurity systems in public and private spaces. As the hackers are getting more skillful daily, more robust cybersecurity with every passing day is needed.AI technologies are being used to detect harmful attacks online and develop ways to eliminate them. Cybersecurity professionals are willing to stay up with emerging challenges such as intrusion, hacking, ransomware, DDS attacks, malware, and more.
The chart below shows the benefits of deploying artificial intelligence (AI) for cybersecurity in selected countries. As of 2019, 36% of IT senior managers claimed AI helps minimize expenses in identifying and reacting to violations within their organizations. AI is playing a growing position in the cyberattacks response of organizations: 83% of US respondents accepted that "We will not be able to respond to cyberattacks without AI."

Image Source: Statista
AI-powered cybersecurity systems can capture data from a firm's own communications networks, digital activities, transactional processes, blogs, and other external public outlets. They run algorithms to detect and track threatening events, suspected data breaches, etc.
AI in Military
Usage of AI tools has been pushed within military systems by several countries and weapons manufacturers. This involves combat drones, ground, marine, aerial equipment, control devices, bots, and missiles. Algorithms that once only lead business processes now help to identify the best destroyers.

Image Source: BBNTimes
Countries store millions of autonomous armed systems, ready to unleash them under the right circumstances. Every country's military units strive to overpower their peers from other countries, particularly those viewed as present and potential dangers. The Chinese military and defense industry has invested extensively in robots, other artificial intelligence applications, and machine learning. In the past, developments in arms systems that have been identified or declared as "autonomous" or "intelligent" have been focused on current capabilities in the research and development of unmanned systems and missile systems.
Hyper Automation
Hyperautomation is the notion that much of what is automated inside an enterprise, such as legacy business procedures, can be automated. AI and deep learning are essential components of hyper-automation and are primary drivers. Hyperautomation made its way into Gartner's list of Top Ten Strategic Technology Trends for 2020.

Hyperautomation offers a high-speed route for anyone to transform their business, assisted by automating highly complicated work. With various technologies, such as Robotic Process Automation (RPA), Machine Learning (ML), and artificial intelligence, hyper-automation offers a way to simplify complicated business processes, particularly where industry professionals were once needed. A core component of hyper-automation is the potential to involve humans in the digitalization process. The first automation technology wave was primarily focused on robotic process automation (RPA). RPA consists of utilizing bots to imitate routine human activities. These processes are regulated and use organized data to complete acts. Contrary to artificial intelligence aimed at simulating the human brain, RPA relies entirely on human behavior. Digital workers function alongside humans to produce unrivaled productivity by hyper-automation.
Reinforcement Learning
Reinforcement learning is the training of machine learning models for making a set of decisions. In an unpredictable, inherently complicated setting, the agent learns to accomplish a target. Artificial intelligence confronts a game-like scenario in reinforcement learning. The machine uses tests and failures to solve the problem.

RL is more about sequential decision-making. In simple words, we can tell that the output is based on the current input status, and the next input is dependent on the preceding input-output. This latest innovation in artificial intelligence enables you to figure out the best actions over the long run. It allows you to figure out what situation requires intervention. It also helps it to identify the right way to earn significant rewards.
Final Words
AI research will make more advancements in the upcoming years and make revolutionary changes in the tech world. To become successful and remain competitive, businesses need to find a way to implement AI efficiently, courageously, and ethically. Let us know in the comments section if you think other emerging AI trends and future insights should be included in the above list.
Book your free 40-minute
consultation with us.
Let's have a call and discuss your product.